

Using statistics report
 Display
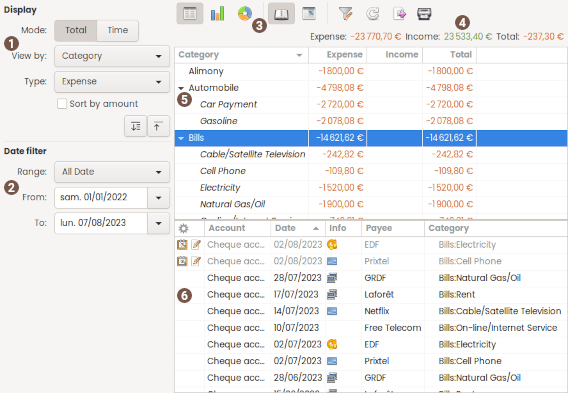
| Mode | Total: will display the total expense/income/balance for the period Time: will display the total per interval for the period |
|---|---|
| View by |
specify the item the result should be computed for:
|
 Balance mode Balance mode |
(view by Account only) the result will be the balance instead of simple expense income sum. |
| Zoom X | (view bar/stack only) select the X zoom factor in real time |
Specific to Total Mode
| Type |
filter the result to:
|
|---|---|
| Sort by amount | sort the result by amount instead of the default order alphabetical for Category/Payee or chronological for Month/Year |
Specific to Time Mode
| Interval |
specify the interval when display mode by Time:
|
|---|---|
| Forecast |
enable/disable forecast See forecast lexicon for more details. |
 Date filter
| Range | fast select a date with predefined range |
|---|---|
| From / To | specify date bound limit to restrict the results to |
 Tool-bar
The tool-bar is the main control of the display. All tool-button have a tool-tip that will help you know what action will be launched when you click on the tool-button. The icon appear or not depending the context.
At the end of the toolbar, there is an export button that enable Result or detail of transaction to copy to clipboard or export into a CSV file
 Total
Total
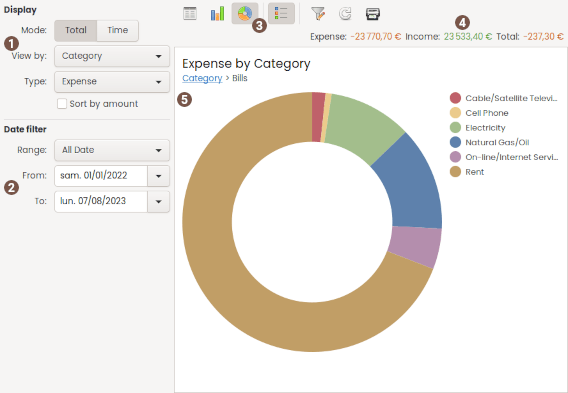
This is the grand total for the period: Expense, Income, Balance.
 Result list / Column chart / Donuts chart
The result list display the computed amounts according to the current selection and filter.
 Transaction detail list
The transaction detail list will show every transaction of the selected item in the above result list.
The columns visible in that list are those configured in the account window.
By default it is not visible. Use the tool-bar 'Toggle detail' button for changing this.
You can also default keep it visible in the Preference dialog